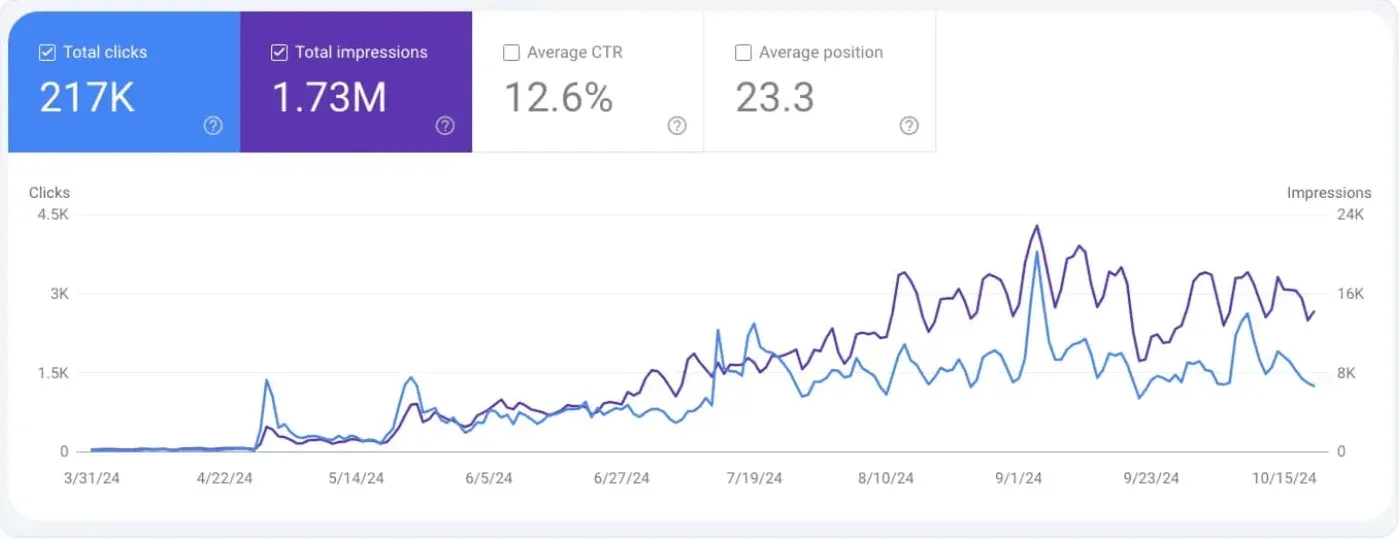
Google Search Console, 31 March to October 2024: 217K clicks, 1.73M impressions, 12.6% click-through rate, average position 23.3. Clicks were near zero until late April 2024, then climbed to about 1,000 to 2,000 a day from August. Clicks peaked near 3,800 in one day, in early September 2024 (read off the chart).
- Client
- Our client, an ecommerce brand
- Source
- Google Search Console
- Period
- 31 March to October 2024
- Services
- SEO and AEO
217K
Google clicks
31 March to October 2024, Google Search Console.
1.73M
impressions
12.6%
click-through rate
23.3
average position
What we did
We built the collection and product pages around what buyers search and linked them together.
Book a free audit
Book a free audit. We audit your site and your business, then deliver the findings.